|
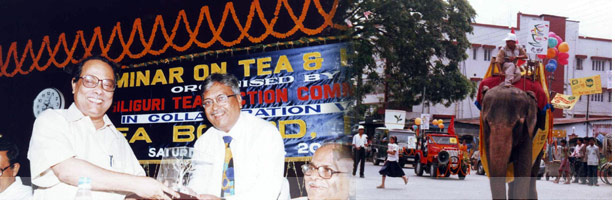
 Tea Production Tea Production
|
| SILIGURI SALE : 2012 (JAN TO DEC) |
| |
2012 |
|
2011 |
| |
In Tonnes) |
Avg |
|
(In Tonnes) |
Avg |
| LEAF |
81,457 |
121.08 |
LEAF |
80,565 |
104.84 |
| DUST |
12,793 |
114.45 |
DUST |
13,147 |
95.03 |
| |
| TOTAL |
94,250 |
120.18 |
TOTAL |
93,712 |
103.46 |
PRODUCTION FOR JAN TO OCT, 2012 AS
COMPARED TO 2011 |
| |
JAN TO SEPT |
OCT |
JAN UPTO OCT |
| |
( In Mkg ) |
( In Mkg ) |
( In Mkg ) |
| |
2012 |
2011 |
2012 |
2011 |
2012 |
2011 |
| ASSAM |
405.7 |
411.07 |
71.8 |
76.4 |
477.5 |
487.5 |
| |
|
|
|
|
|
|
| DARJ |
7.8 |
7.9 |
0.8 |
0.9 |
8.6 |
8.8 |
| DOOARS |
111.5 |
116.6 |
18.2 |
19.1 |
129.7 |
135.7 |
| TERAI |
68.7 |
63.3 |
12.3 |
13.8 |
81.0 |
77.1 |
| TOTAL(W.B.) |
188.00 |
187.8 |
31.3 |
33.8 |
219.3 |
221.6 |
| |
|
|
|
|
|
|
| NORTH INDIAN |
600.1 |
605.0 |
104.7 |
111.9 |
704.8 |
716.9 |
| SOUTH INDIAN |
172.4 |
177.6 |
24.9 |
23.3 |
197.3 |
200.9 |
| |
| TOTAL |
772.5 |
782.6 |
129.6 |
135.2 |
902.1 |
917.8 |
|
|